Free email delivery
Please sign up for email delivery in the subscription area to the right.
No salesman will call, at least not from us. Maybe from someone else.
Passerine evolution likely began in Australia
[Posted by Chuck Almdale]
The following study, now several years old but years in the making, presents evidence for Australia as the origin of all Passerine birds.
A few highlights of the paper:
- Increases in Cenozoic (66 Million years ago to now) global temperature or colonization of new continents were not the primary forces driving passerine diversification.
- Analyzed DNA data from 4,060 nuclear loci, 221 individual birds representing all 137 passerine families and major subgroups.
- Suggests that passerines originated on the Australian landmass ∼47 Ma.
- Subsequent dispersal and diversification of passerines affected by a number of climatological and geological events, such as Oligocene glaciation and inundation of the New Zealand landmass.
- Previously, due to lack of reliably vetted fossils, the age of crown passerines had been calibrated based on the geological separation of New Zealand from the rest of Gondwana in late Cretaceous ∼82 Ma.
- Split between oscines and suboscines ∼44 Ma, occurs well before the appearance of ephemeral ice sheets in Antarctica during Late Eocene, which would have made the trans-Antarctic route implausible.
- Specific ecological, geological, and climatological events proposed to be associated with the diversification and global distribution of Neornithes:
- Opening of ecological niches following the Cretaceous-Paleogene (K-Pg ~66 Ma) mass extinction event (that dinosaur-killing meteor).
- Establishment of dispersal corridors linking the geographic origin of modern birds to other landmasses during the Paleogene.
- Rapid continental drift and island formation in Wallacea allowing the dispersal of songbirds out of Australia.
- Fragmentation of tropical habitats during cooling events of the Late Cretaceous and Cenozoic.
- Expansion of temperate habitats and retreat of glaciers during the Miocene.
The following will help you in reading the paper:
Crown Passerines: In phylogenetics, the crown group or crown assemblage is a collection of species, composed of the living representatives of the collection, plus the most recent common ancestor of the collection, plus all descendants of the most recent common ancestor. It is thus a way of defining a clade, a group consisting of a species and all its extant or extinct descendants. For example, Neornithes (birds) can be defined as a crown group, which includes the most recent common ancestor of all modern birds, and all of its extant or extinct descendants.
Oscine Passerines: Suborder Passeri, 5126 species. The half of the world’s birds with a fully developed syrinx, that can sing nicely and learn new songs.
Suboscine Passerines: Passerines with different syrinx structure, poorer singing, and can’t learn new songs. The 1348 suboscine species are classified in Suborder Tyranni, in three infraorders: Tyrannida – Tyrant Flycatchers & allies 10 families; Furnariida – Ovenbirds & allies, 9 families; Eurylaimides – Broadbills & allies, 5 families.
Acanthisitti: New Zealand Wrens, which are neither oscine nor suboscine. 1 family 2 species. They are not “wrens” as are those in the Americas and Europe.
This links to a useful cladogram which includes English names of families.
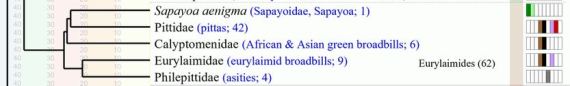
This links to a Wikipedia list of Passerine families (with links) with a nice cladogram.
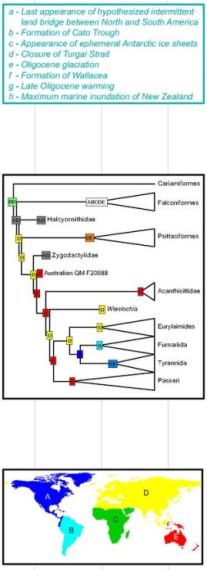
The figures below are from the paper and are as large as I could fit onto this blog. You can download free jpeg files of the originals from the paper, linked below. The big star at the top of Figure 2 connects to the star at the bottom of Figure 1. All horizontal lines are time-lines; geological eras are at the bottom. The charts are data-rich, you can spend hours looking at them. The quote below is merely the introduction to the paper, it’s not even the abstract. There is much more.
Earth history and the passerine superradiation
PNAS | Carl H. Olveros & 31 others | 1 Apr 2019
Proceedings of the National Academy of Sciences of the United States of America
Significance
Our understanding of the factors that affected the diversification of passerines, the most diverse and widespread bird order (Passeriformes), is limited. Here, we reconstruct passerine evolutionary history and produce the most comprehensive time-calibrated phylogenetic hypothesis of the group using extensive sampling of the genome, complete sampling of all passerine families, and a number of vetted fossil calibration points. Our phylogenetic results refine our knowledge of passerine diversity and yield divergence dates that are consistent with the fossil record, and our macroevolutionary analyses suggest that singular events in Earth history, such as increases in Cenozoic global temperature or the colonization of new continents, were not the primary forces driving passerine diversification.
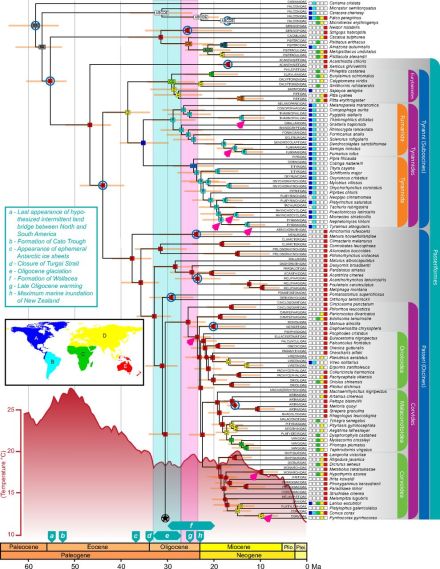
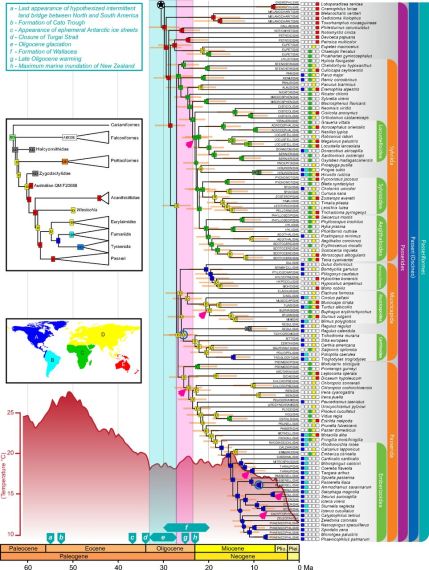
Fig. 2. Family-level phylogenetic relationships in passerines reconciled from concatenation and coalescent analyses (connects to bottom of Fig. 1 at the circled star). Biogeographic reconstruction including fossil taxa (Inset, tree) yields identical ancestral areas for crown lineages of passerines, suboscines, and oscines (also SI Appendix, Fig. S8). Plei., Pleistocene; Plio., Pliocene.
That’s all. Have fun.
Singaporian birders have problems with pipits
[Posted by Chuck Almdale, submitted by Lillian Johnson]
It’s not just American birders that have problems separating the common birds from the rarities. Photos, books and the discerning eye are essential.
PIPIT101: Identifying Singapore’s First Tree Pipit Anthus trivialis
Singapore Birds Project | Richard Wright | 25 Oct 2021 | 8 min read
Introduction to the article:
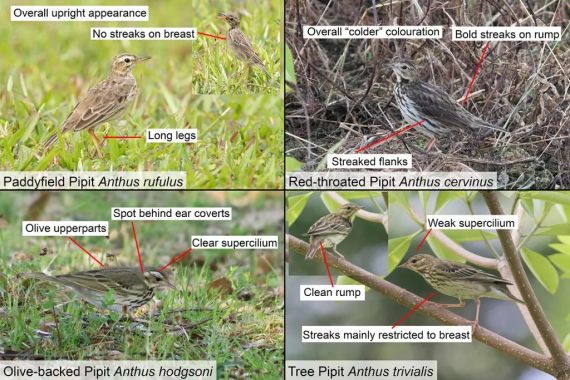
The birding community was presented with an identification challenge today with the arrival of a vagrant pipit species. These small, brown, streaky birds can be difficult to identify at the best of times. An unfamiliar, out of context, vagrant can be a real headache. So how to start the identification process? These notes might help.
Worldwide, there are about 40 species of pipit, mostly in the genus Anthus. Within Southeast Asia nine species are regular; in Singapore Paddyfield Pipit A. rufulus is a resident breeder, Red-throated Pipit A. cervinus is an annual non-breeding visitor in small numbers and Olive-backed Pipit A. hodgsoni is a rare vagrant with only one record at Bidadari in December 2010.
Saving water during a drought*
[Posted by Chuck Almdale]
*We live in a desert. Assume there’s always a never-ending drought, and live knowing that.
The Los Angeles Times recently had another of it’s periodic tips on water saving, which we’ll get to in a minute. Among other information points, they mentioned that last July Governor Newsom asked Californians to reduce residential water usage by 15%, which, in my opinion, should be achievable by all Californians. But many Californians have already instituted all the saving measures suggested below, and already achieved such reductions, and for them saving an additional 15% will be difficult.
Who is using the water
And—and it’s a big and—we also recognize that a great deal of California’s water usage is out of the hands of homeowners and apartment-dwellers. There’s also agriculture, industry and the general environment. Here’s a chart from PPIC (Public Policy Institute of California) who are particularly interested in our water.
[Note: maf = million acre feet; 1 acre-foot = 325,851 gallons.]

The quick take-away from the chart is that while usage fluctuates from wet to dry years, our environment (aka nature) consumes roughly 50%, agriculture 40% and urban (including industry) about 10%. (PPIC). It’s also very interesting to note that total water usage does not include “conveyance losses…8% for agriculture.” This sounds like agricultural leakage is almost as much as all Urban usage. Something to think about, there.
Hello to the Los Angeles Times
On 10/10/21, the L.A. Times had an article by Steve Lopez: “Gulp! Are they using water in a fair way?” It describe just how much water one of the ~120 golf courses in the Coachella Valley (Palm Springs and environs) uses every night: 1.2 million gallons on average. I sent them a letter, which they published a few days later, albeit slightly modified:
Dear editors and Steve Lopez:
In Feb. 2009 we replaced the grass front lawn of our small San Fernando Valley home with drought-tolerant California native plants. No reimbursement ever received. Many plants are now large; some have died. We get compliments and our yard was part of a study of native-plant yards.Our water usage shrank 62%, saving 1,229 HCF (919,356 gallons) of water, and $6,333 in DWP charges. I like that. I don’t like knowing that one of the 120 Coachella Valley golf courses blows through our entire 12 2/3rds years of water savings in 9 1/4 hours, every single night.
In the permanently drought-stricken 4/5ths of Australia called “outback,” golf course fairways are dirt and “greens” are compacted black sand. People play on them daily. Some—Greg Norman and Jason Day, to name two—go on to world fame. Coachella golfers and golf course owners, state water resource managers, water-drinkers, are you listening?
I do not mind at all “doing my bit.” Americans are called upon from time to time to “pitch in.” During World War II Americans by the millions grew Victory Gardens, collected used tires and newspapers and metal cans, gave up copper and butter and eggs and new cars, scrimped and saved and went without—for years. It is—or should be—the same thing now. This is a war against adverse changes in our global climate, mostly of our own making, and the shrinking supply of fresh water is the most imminent battle in that war.
But, as my letter-to-the-editor indicates, it’s very annoying to do the best you can, and discover that what our household has individually accomplished is less than a drop in the bucket compared to the overuse and wastage going on elsewhere, every day.
And—and this is one of those big “ands”—because the notes to the chart above says, “Urban (7.9 maf) includes residential, commercial, and industrial uses; and large landscapes,” I suspect that golf courses are included in Urban usage, and thus can constitute a big chunk of Urban’s already relatively paltry portion of 10% of total California water usage.
A California behavioral study on energy usage
Here’s a study1 of prosocial behavior, done right here in California in 2007. The Dept. of Water and Power ought to know about it and use it.2
Researchers made residents of a California neighborhood more aware of energy usage levels in their community. Households were first identified as using more or less than their neighborhood average. Randomly selected Group One households were notified with a post card highlighting how much energy they used and how much the neighborhood averaged. Group Two households got the same information, but with a smiley face if they consumed less energy than the average, and a sad face if they consumed more than the average.
Weeks later, the researchers again measured energy usage. Group one households had cut back and conserved energy if they had been consuming more energy than average, but significantly increased usage if they had been consuming less energy than average.
Group two households—those who got the smiley or sad face stickers—also cut back and conserved energy if they had been consuming more energy than average, but did not significantly increase their usage if it was already below average.
The simple addition of smiley face or sad face reminded people to either join the rest of the neighborhood in conserving energy or that they were already doing the right thing and to keep on doing it.
Dept. of Power and Water—are you listening? Stick those smiley or sad faces on the bills and watch the conservation climb.
The Los Angeles Time article
Having said all that, here are tips for the ordinary citizens of California, with comments from L.A. Times journalist Jessica Roy. [And some from me, where appropriate, in brackets.] Many of you have already done most or all of these things. If you haven’t, here’s a reminder.
How to save water during a drought
Los Angeles Times | Jessica Roy | 2 Nov 2021 | 8 minute read
Rip out your lawn, or at least water it less.
This saves 40-80 gallons per watering. [Our water usage immediately dropped 70% when we took out our front lawn. As native plants grew in, they needed water, and our 12.67 years overall savings is 62%. If you insist on watering your lawn, longer, slower, deeper & fewer soaks are better than numerous short soaks because they will make the roots grow deeper.]
Replace non-native plants.
They suck up more water than natives, and native plants make our friendly native birds and bugs happy.
Find and fix leaks.
Watch your water bill. If it moves higher than usual, you may have a leak. Fix it immediately. [The two times in twelve years we went into Tier 2 water usage was due to a silent-running toilet, and a dying pressure valve. The high usage noted on the bill clued us in.]
Replace old appliances, shower heads and toilets.
Toilets made before 1990 can use 6 or more gallons per flush; new toilets can use as little as 1.28 gallons. A new shower head can save 12 gallons. [Turn off the water while lathering and you’ll save 75% or more.]
Small things add up.
Don’t run water while washing dishes or while washing your face, brushing your teeth or shaving. Don’t wash your car so much; a little dust won’t kill you. No more hour-long or even quarter-hour-long showers. Capture in a bucket the water you run to warm up the shower, then water your plants with it. Do the same at your kitchen sink. Make sure your lawn sprinklers aren’t watering the driveway or street or squirting 15 feet into the air. Sweep your driveway and sidewalks with a big push broom, not with rivers from your hose. Replace that costly gym membership with housework and home maintenance.
Other things we consume use water.
Raising fruit, vegetables, meat. New cotton T-shirt: 650 gallons. Plastic: 22 gal./pound. Smartphone: 3,000 gallons. Single-use 1-liter plastic water bottle: over 1 liter of water. [1 gallon per almond. 12 gallons per glass of wine.]
Other things you can do.
Write annoyed letters to your local paper. Ask your homeowners association to pull up the grass and install native plants. [Contact your politicians to back water-saving laws that target not just homeowners, but entities that use a thousand—or a million—times more water.]
I’m sure I missed something. Read the L.A. Times article.
Notes:
1. Schultz, P.W., Nolan, J.M., Cialdini, R.B., Goldstein, N.J., & Griskevicius, V. (2007). The constructive, destructive, and reconstructive power of social norms. Psychological Science, 18, 429-434.
2. The Life-Changing Science of Detecting Bullshit, by John V. Petrocelli, 2021. St. Martin’s Press, New York. pgs 245-46.
Black Metaltail, the coolest of birds | Metallura phoebe
[Posted by Chuck Almdale]
It’s hard enough to believe that tiny hummingbirds can thrive in the high Andes, but many do very well in the very thin air and painfully cold nights. There can be a lot of flowers up there that no other birds are using, so competition for sugar is reduced. And they get through the night by going into torpor, a temporary hibernation-like state where they slow everything way down.
- Body temperature drops from 40°C (104°F) to 3.26°C (37.9°F), as low as 1°C above ambient air temperature
- Heart rate drops from 1,200 beats/minute to as low as 40 beats/minute
- Torpor cuts their energy use by 95%
- This is the lowest temperature ever recorded in birds or non-hibernating mammal
- Torpor investigations done at over 12,460 ft. in the Andes
Video of Black Metaltail in flight – 50 seconds
Link to original paper:
Extreme and variable torpor among high-elevation Andean hummingbird species
Royal Society Publishing | Blair O. Wolf, et.al. | 9 Sep 2020
Abstract:
Torpor is thought to be particularly important for small endotherms occupying cold environments and with limited fat reserves to fuel metabolism, yet among birds deep torpor is both rare and variable in extent. We investigated torpor in hummingbirds at approximately 3800 m.a.s.l. in the tropical Andes by monitoring body temperature (Tb) in 26 individuals of six species held captive overnight and experiencing natural air temperature (Ta) patterns. All species used pronounced torpor, with one Metallura phoebe reaching a minimum Tb of 3.26°C, the lowest yet reported for any bird or non-hibernating mammal. The extent and duration of torpor varied among species, with overnight body mass (Mb) loss negatively correlated with both minimum Tb and bout duration. We found a significant phylogenetic signal for minimum Tb and overnight Mb loss, consistent with evolutionarily conserved thermoregulatory traits. Our findings suggest deep torpor is routine for high Andean hummingbirds, but evolved species differences affect its depth.

This hummingbird survives cold nights by nearly freezing itself solid
The black metaltail goes into a state of suspended animation, becoming ‘cold as a rock’
Science News | Jonathan Lambert | 8 Sep 2020 | 2 min read
The Coolest Hummingbird, as Measured by an Actual Thermometer
Black Metaltail. The name seems fit for a hard-hitting rock band, but this bird’s cool factor goes way beyond its heavy-metal moniker.
Cornell Lab-All About Birds | Marc Devokaitis | 20 Dec 2020 |
Exploring M87’s Supermassive Black Hole | How the Universe Works
[Posted by Chuck Almdale]
If you’re still staying at home most of the time and feeling really cooped up, take this short (10:24 minutes) trip to nearby galaxy M87, get a close-up view of the supermassive black hole at its center, as well as the giant jets of light shooting out of it. It’s worth the trip, you’ll return refreshed and ready to face another day of quite desperation.
If you liked that one, try this one, only 52 seconds long.


