King tides again January 11-13, 2021
[Posted by Chuck Almdale]
We are posting this yet again as a public service.

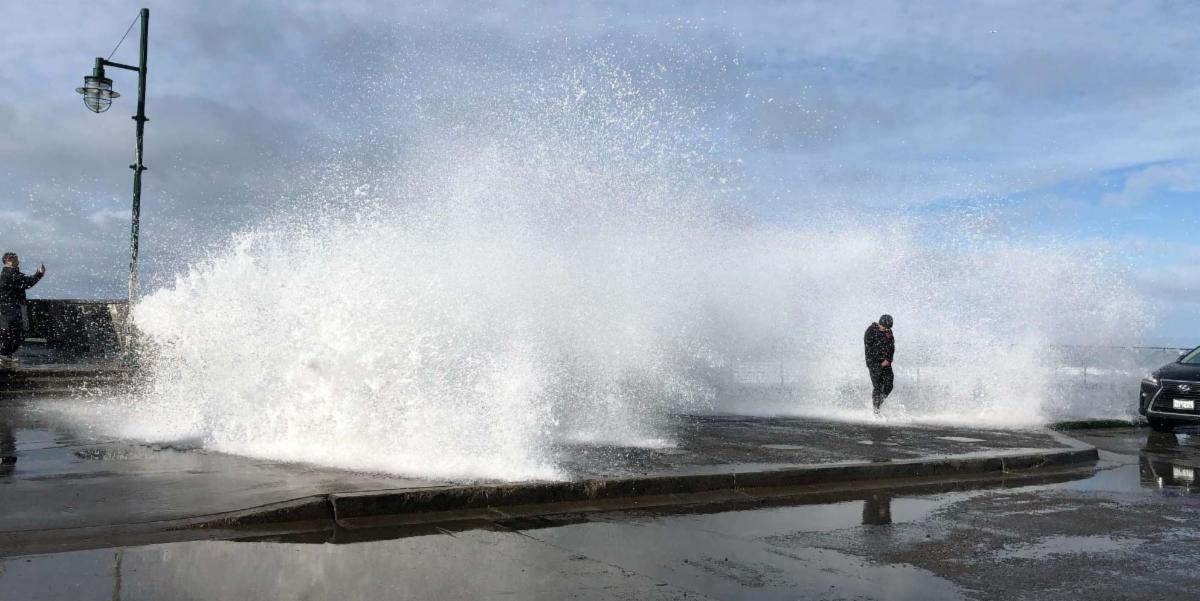
Not much dry beach during the 11-16-20 king tide. (Larry Loeher)

Even less during the 12-15-20 king tide. (Larry Loeher)
I don’t know if this actually qualifies as an actual “King Tide” but these are the highest tides of January, as they coincide with the New Moon.
High Tides: Jan 11 6.48 ft. @ 7:13am | Jan 12 6.55 ft @ 7:58am | Jan 13 6.46 ft @ 8:42am
Low Tides: Jan 11 -1.50 ft. @ 2:42pm | Jan 12 -1.60 ft @ 3:24pm | Jan 13 1.50 ft @ 4:05pm
The next really high tides will be May 25-27 with the high of 6.67 ft. @ 9:24pm, May 26.
All these numbers come from here for the ocean pier at Mugu Lagoon.
Just for the sake of comparison, here’s the numbers for the previous two King Tides:
High Tides: Dec 13 6.74 ft. @ 7:27am | Dec 14 6.85 ft @ 8:08am | Dec 15 6.74 ft @ 8:50am
High Tides: Nov 14 6.60 ft. @ 7:51am | Nov 15 6.79 ft @ 8:28am | Nov 16 6.75 ft @ 9:06am
Not much difference. Jan 12 is only 0.3 ft. (3.6″) lower than Dec 14.

You never know what might show up. Here’s a beautiful male Hooded Merganser
during the 12-15-20 King Tide (Grace Murayama)
The King Tide alert below wants photos from you if you live north of Vandenberg/Point Conception.
| The highest high tides of the year are on their way |
 Look out for King Tides! Look out for King Tides! For locations North of Vandenberg/Point Conception, Jan. 11-12, 2021 The California King Tides Project is calling on you to photograph our highest high tides of the year. Documenting these tides helps us preview the impacts of sea level rise and understand how our shoreline is affected by high water today. If you’re able to safely take photos at the coast or Delta during King Tides you will be contributing to an important community science effort. Find your local King Tide times and learn how to upload your photos on our website or with a free app. You can check out a selection of photos from each coastal county and access a map of all the King Tides photos from the last few years. Educators and parents can find ways to incorporate King Tides into student learning, including with an elementary-level science journal downloadable in English or Spanish. Middle and high school students may want to use King Tides images and concepts as they enter the Climate Video Challenge. We can’t wait to see your photos! In the meantime, please join us on social media for #KingTides: What causes sea level rise, and what do King Tides have to do with it? The sea level rise we’re experiencing now and will experience in the future is caused by burning fossil fuels like coal, oil, and natural gas. Carbon dioxide in our atmosphere acts like a blanket, trapping in heat that would otherwise escape. When we burn fossil fuels, we’re adding more carbon dioxide, “thickening the blanket” and warming the planet and ocean. Sea level is rising because land-based glaciers and ice sheets are melting into the ocean and also because water expands in volume when it warms. The amount of sea level rise we will ultimately experience will depend on how quickly we stop burning fossil fuels. King Tides themselves are not caused by sea level rise, but allow us to experience what higher sea level will be like. King Tides are the highest high tides of the year, about a foot or two higher than average tides, which corresponds to the one to two foot rise in sea level expected during the next few decades. When you observe the King Tides, imagine seeing these tides (and the flooded streets, beaches, and wetlands) every day. Understanding what a King Tide looks like today will help us plan for sea level rise in the future. Sharing your photos and talking about what you’ve noticed helps others understand that they’re part of a community that cares about climate change. Why are there different dates for northern and southern California? Southern California will experience King Tides in November and December. There is an additional January King Tide in northern California, north of Point Conception/Vandenberg AFB, due to a combination of astronomical influences such as the relative tilt of the Earth’s rotation with respect to the Sun and seasonal influences on water level such as temperature and wind that differ in southern California as compared to northern California over the course of the year. Thank you for your help! We look forward to seeing your photos! california.kingtides.net |
| California Coastal Commission 455 Market Street, Suite 228, San Francisco, CA 94105 |
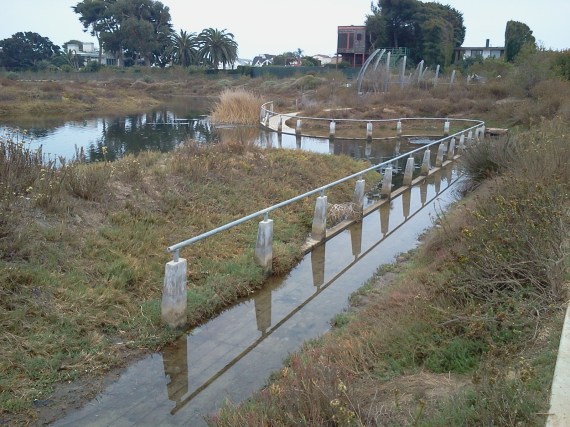
An inundated tidal clock sidewalk measured 6′ 9.6″ lagoon water
level a week after the king tide. (L. Johnson 11-23-20)
Discover more from SANTA MONICA BAY AUDUBON SOCIETY BLOG
Subscribe to get the latest posts sent to your email.


