Water III: rainfall, watershed, creek, lagoon, beach, ocean
[By Chuck Almdale]
Warming ocean and Kelvin wave
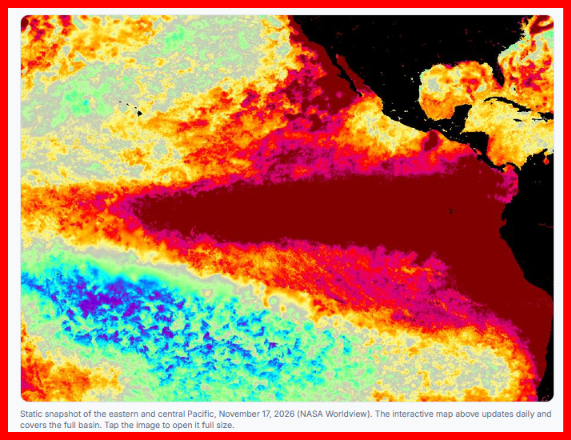
While the water coming down the creek during the storm of October 21-23 certainly helped to erode the beach and cut the hand-dug trench far deeper and wider, I suspect that most of the inundation we witnessed was due to the overall warm sea water and the Kelvin wave that flowed north from the equator, reaching Southern California in early October. Predictions for the Kelvin wave effect ranged from 4 inches to two feet, although I suspect the higher estimates included general ocean warming. In an effort to narrow that large prediction range I managed to hunt down some information.
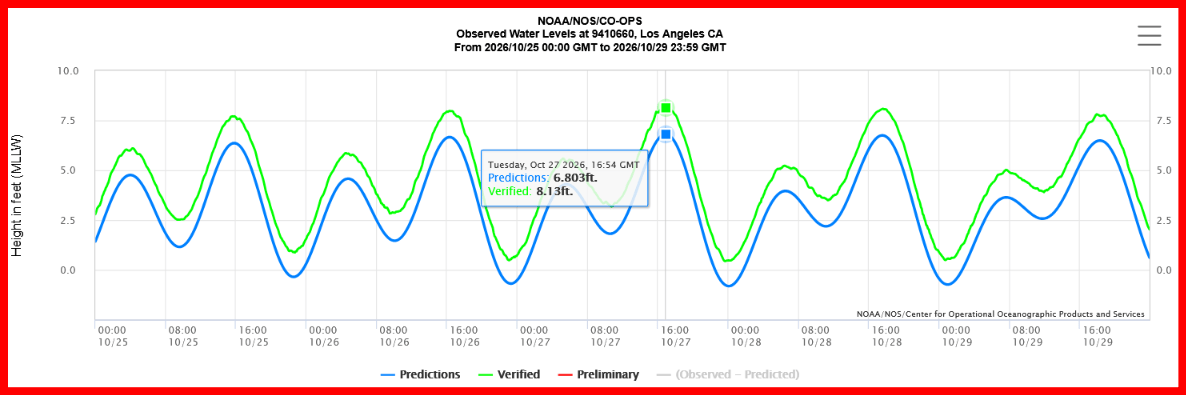
NOAA San Pedro station ID #9410660 (chart for Oct. 24-28, 2026), located at the L.A. Pilot Service Pier in the L.A. Outer Harbor, has a useful tide chart that compares astronomically predicted and actual water levels. Here are some pertinent data:
October 25: High tide 8:42 am predicted 6.357 ft, actual 7.70 ft, difference 16.1 inches
October 26: High tide 9:18 am predicted 6.662 ft, actual 7.98 ft, difference 15.8 inches
October 27: High tide 9:48 am predicted 6.802 ft, actual 8.19 ft, difference 16.6 inches
October 28: High tide 10:36 am predicted 6.746 ft, actual 8.09 ft, difference 16.1 inches
For context, data at this station goes back to 1923. Its previous high water record was 7.93 ft, set in 2005. This record was almost broken on October 25th, a new record was set on the 26th, a newer new record was set on the 27th, and the 28th was lower than the 27th, but still higher than on the 26th.
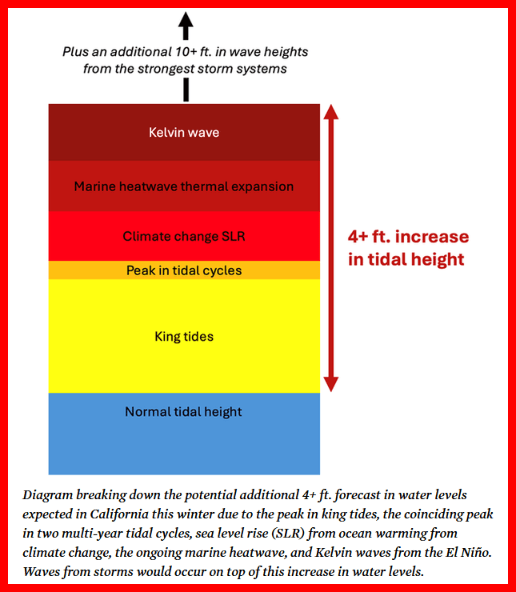
An article from the Union of Concerned Scientists made the following points on Oct 27, 2026.
- Annual fall-winter king tides add 1-2 feet to the average high tides.
- Two tidal cycles are also peaking this year: a 4.4 year cycle (lunar perigean and declinational harmonics), and an 18.6 year cycle (lunar nodes) is entering its rising period. These two cycles will add 2-4 inches this winter.
- We are undergoing fossil-fuel driven climate change
- The oceans have absorbed 91% of the heat from fossil-fuel driven climate change. Warming water expands, raising sea level.
- Warming climate melts ice sheets and glaciers.
- Global warming has already raised ocean levels approximately 8 inches since 1901.
- Total effect of king tides, lunar cycles, and global warming is about 2.5 feet this winter.
- A category 4 (extreme) marine heatwave off Baja and Southern California since early this year is adding an additional 6 to 10 inches to sea level due to thermal expansion.
- The Kelvin wave which reached Southern California in early October is adding another 6 to 12 inches.
Put all this together and sea levels may be as much as 4 feet above the usual high tides level; we’ll see flooding in in coastal communities such as Long Beach and Newport, and pieces of people’s lives floating away to sea. And that’s before you add in the usual winter storm surges and atmospheric rivers we’ve learned to expect from time to time.
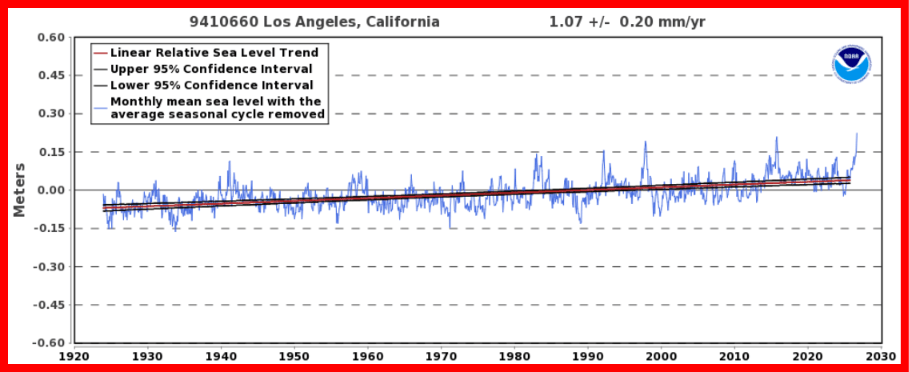
The effects of global warming on sea levels are less in Southern California than worldwide averages because we live in a tectonic zone, and the land beneath our feet is slowly rising. Global sea level has risen 6-8″ since the 1920’s, but only 4.33 inches at San Pedro (1.07+/- 0.2 mm per year x 103 years). That’s the benefit of living in a crustal fault zone. Lucky us.
Unusual Wildlife Sightings
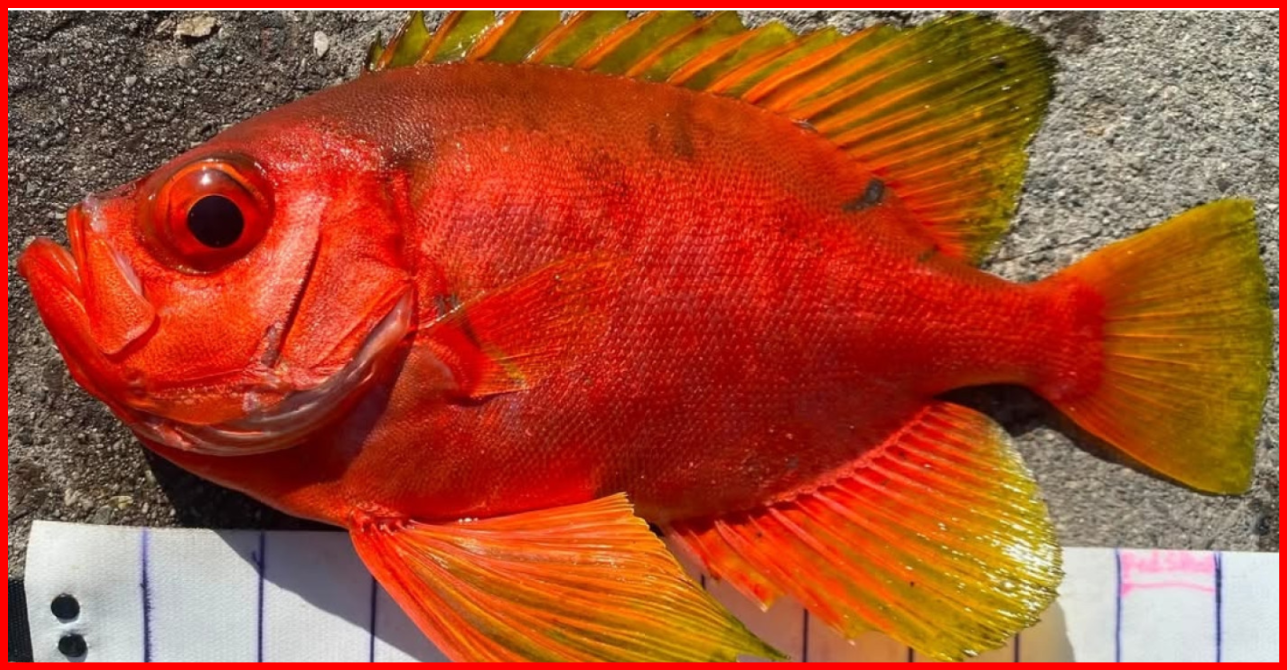
According to an interesting article in The Atlantic and other sources, researchers at Scripps Institute have been recording much warmer waters and never-seen-before sealife at their pier in La Jolla. On November 3, the water temperature was 75°F, eleven degrees warmer than expected, setting a new record for that date. New records are no longer particularly noteworthy. That’s the 65th daily record so far this year. On their underwater camera they watched a Razor Surgeonfish pass by. Another first.

There have been about ten other fish new to California, in addition to uncommon fish appearing in great numbers, including: Blue Marlin, Giant Manta, Hammerhead Shark, Longfin Bigeye, Mahi-mahi, Orange Creolefish, Star-studded Grouper, Three-banded Butterflyfish, Wahoo, Whale Shark, Yellowfin Tuna. Pilot Whales and Yellow-bellied Sea Snakes. [Reuters video] And then there’s the sea turtles coming ashore and laying eggs; two Olive Ridley Sea Turtles in September at Seal Beach and Huntington Beach in Orange County, and another in Ventura County at San Buenaventura Beach in November [NOAA].
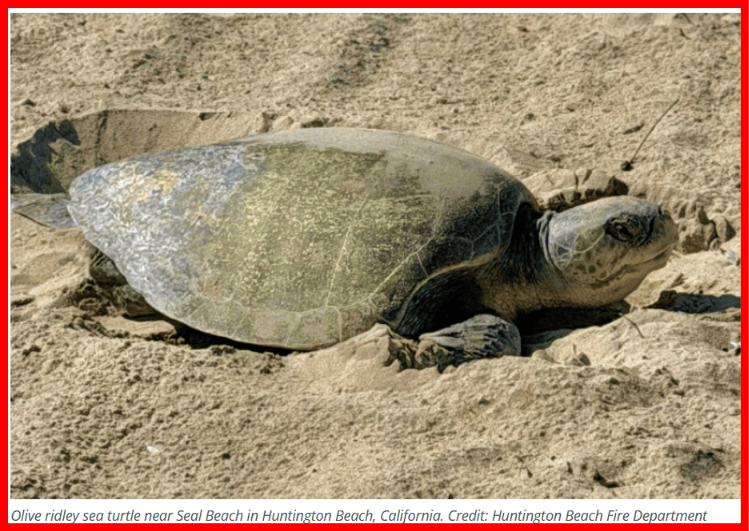
The turtle eggs laid at the Orange County sites were collected, incubated, and beginning on Nov. 16, the hatched young were released back to the sea. (Guardian) The eggs laid in Ventura County were not collected and were lost to the sea in the high tides.
Link to Aquarium of the Sea hatchling release video.
Does anyone mention Malibu Beach in these reports? Not really. Too small, no harbor.
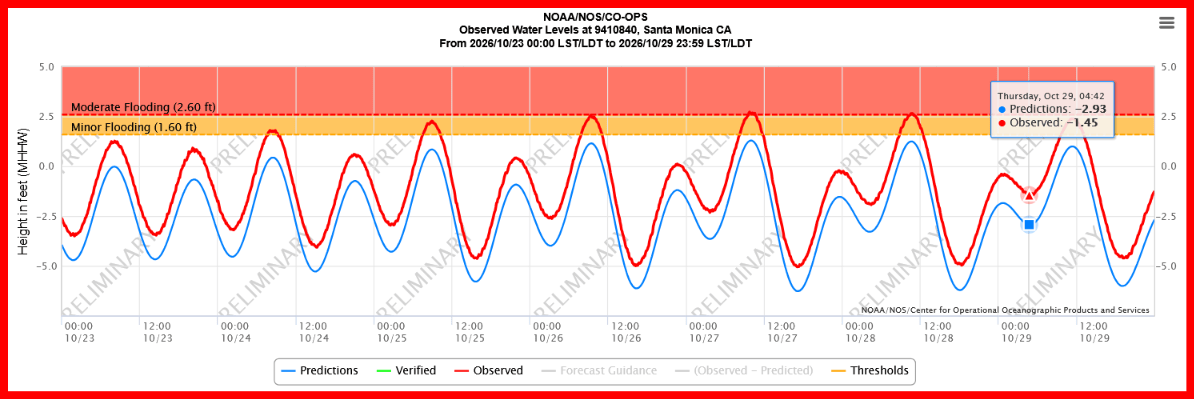
But they get close. NOAA mentions Santa Monica in one article from November 4, 2026:
“Santa Monica, CA – 2.72 feet above MHHW (2nd highest on record).”
This was accompanied by a chart showing predicted sea level, actual sea level, and the range for local flooding on Oct. 26-28, 2026. Moderate flooding was possible. This chart doesn’t show Mean High High Water, and the largest difference I could find between predicted and actual was 1.45 ft. on October 27 at 9.42 am. That’s 17.4 inches, slightly more than the record-setting difference seen at San Pedro at the same time.
More Kelvin waves, warm water, lunar cycles, king tides coming our way. And that’s before you add in the usual winter storm surges and atmospheric rivers.
In fact, an atmospheric river is expected to hit southern and Central California tonight, Wednesday, November 18, with the heaviest rain to fall tomorrow.
Water I: Rainfall, watershed, beach erosion, Rindge Dam
Water II: Storm of October 21-23, 2026, lagoon and beach effects
Water III: The warming ocean
Discover more from SANTA MONICA BAY AUDUBON SOCIETY BLOG
Subscribe to get the latest posts sent to your email.