Free email delivery
Please sign up for email delivery in the subscription area to the right.
No salesman will call, at least not from us. Maybe from someone else.
[Posted by Chuck Almdale, submitted by Lillian Johnson]
Bird rescue operation in Long Beach seeks to save elegant terns
Los Angeles Times | Faith E. Pinho | 16 July 2021

It’s quite likely that the Elegant Terns who abandoned their nests at Bolsa Chica (reported June 4 and June 8) after a drone crashed in their midst then moved up to the Long Beach Harbor for a try at barge life. International Bird Rescue is now rescuing nestlings fallen into the water from the barges and needs donations to cover their additional expenses including the cost of the 100+ pounds of fish they gobble down every day.
The following is the introduction to today’s story on the Los Angeles Times website.
It’s been a tough year for elegant terns in Southern California.
A drone crash in June forced an estimated 3,000 of the sleek seabirds with their pointed orange bills to abandon their eggs on Bolsa Chica Ecological Reserve in Orange County. Experts say it’s possible that many of the birds set up camp on two commercial barges in nearby Long Beach Harbor.
Now droves of the baby birds are falling into the ocean and drowning.
“They basically landed on the barge a day or so, and it may have been two or three days, after the incident involving the drones when they left Bolsa Chica,” said Tim Daly, spokesman for California Department of Fish and Wildlife. “There’s really no way of proving or knowing, but we think there’s a possibility, because they suddenly appeared.” More…

[By Chuck Almdale]
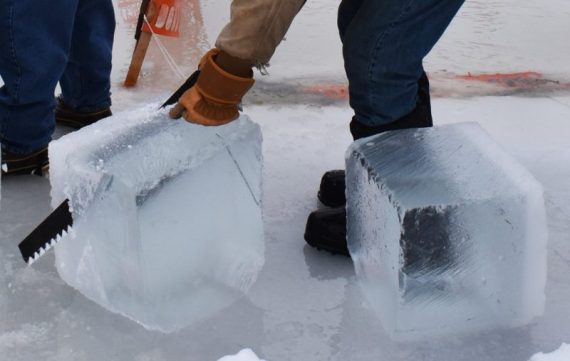
One way to beat summer heat (Source: Wisconsin Life)
Your electrical utility wants you to pre-cool your home. Pre-cooling may save you money and definitely lowers utility managers’ levels of stress. Month after month of torrid days with high peak demand make these people very uncomfortable. Do pre-cooling right* and it won’t be any worse than what you live with now. It may even be better.
*Doing it right means:
Read this posting, check with your local utility, experiment, take notes, be lucky.
What is pre-cooling?
Pre-cooling means cooling your home before you actually need it, letting your A/C “coast” during the worst part of the day, then turning it on again after the high peak if you need it. The worst of the day, utilities say, is during the period of peak demand. This typically is the hottest part of the day as that’s when everyone cranks up their air conditioner. That’s what they want you to stop doing (cranking it up). Thus…pre-cooling.
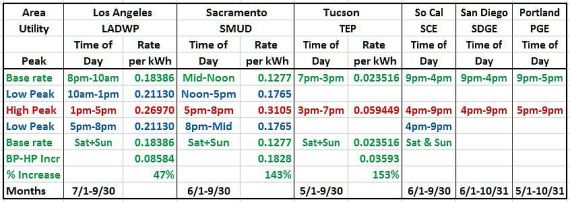
Figure 1. Six utilities: Time-of-use periods and rates (where available).
Utility Links:
Los Angeles Dept. of Water & Power
Portland Gas & Electric
Sacramento Municipal Utility District
San Diego Gas & Electric
Southern California Edison
Tucson Electric Power
[NOTE: Some utilities such as Southern California Edison – which admittedly serves many localities with differing conditions – hide their rates from the merely curious, partly because they have many options available. Current customers may uncover their options by logging into their accounts.]
Definition: kWh – kilowatt-hour – A measure of electrical energy equivalent to a power consumption of 1,000 watts for 1 hour.
Worth knowing: Water can be stored behind a dam for society’s future use. Electricity cannot. What you’re taking out of the wire must be simultaneously generated and stuffed into the other end of the wire. The closest thing we have to storage of massive quantities of electricity is…water behind a hydroelectric dam.
Utility electrical rates and high-low peak rate differences vary
LADWP high peak rate is 47% higher than their base rate of $0.18386 per kilowatt-hour.
Tucson Electric Power high peak rate is 153% higher than their base rate of $0.023516 per kilowatt-hour. That’s a big increase but from a base rate that’s 87% lower than LADWP.
Utilities differ in their suggestions about how best to do pre-cooling.
What they do agree on is:
- Smart (programmable) thermostats are very handy. You can “set ‘em and forget ‘em,” which is mostly true.
- Cool you home before (and after, if needed) the high peak period – at night and/or in morning.
- If you need some cooling during the peak (e.g. leaky house, poor insulation, it’s really hot outside) set your (smart!) thermostat to 3°F above your preferred setting.
To be more specific:
- Find out your utility’s peak hour time bracket. For the 3 hours preceding that, set your A/C thermostat to 3°F below your preferred temperature (longer, if necessary). During the peak bracket, set to 3°F above your preferred temperature. At the end of the peak bracket, set it to your preferred temperature.
- They really want your preferred temperature to be 78°F or higher, certainly not 68° or 72°F.
- If your utility has three (or more) rates—base, low peak and high peak rates, as does LADWP—you may want to pre-cool during base rate and let it “coast” during all low peak and high peak periods. This may be too long for you to tolerate. This is where experimentation and taking notes comes in.
- The Sacramento Bee suggested during their 2020 heat wave, “Set the thermostat low each evening after 9 p.m. Cool your house as much as possible until about 1 p.m. the next day. Then, turn the thermostat up to avoid stressing the community’s grid system.” Again: experiment.
Rate schedules options vary
Besides time-of-use (TOU) rate schedules, there may also be:
- The self-explanatory same-rate-never-changes rate schedules
- Tiered rates schedules which charge by total electricity used per month: the more you use the more you pay for your usage above the lower tiers. Again, you have to know what your local utility offers. They’re all different.
- Video on LADWP two residential rate plans: Standard 3-Tiers (R-1A) and Time-of-Use (R-1b) (3 minutes)
Got solar panels?
Lucky you, you’re almost in a different ballpark. Depending on the number of panels and how much it generates versus your usage at high peak, you may be able to ignore everything I’ve written so far. But there are a few things to consider:
- If you run your A/C or recharge your Tesla (see below) during low light/base rate periods, you’ll be drawing on power from the utility.
- If you use your A/C or charge your car by drawing on your solar panels, you’ll be doing this during high peak periods.
- If you’re using your own panel power during high peak, you’re not selling your electricity to the utility at the highest rate possible.
- You may be better off dollar & power-wise by selling your power during high peak and using their power during base rate periods to cool and charge things. You may also be providing more benefit to your community by doing this.
- Your utility may not provide many—or any!—price or time-of-usage incentives; they may pay you for your electricity at a rate lower than they charge you for their electricity; or not pay you at all. Always check with your utility.
- If you use your panels largely to supply power to the utility, they may be more efficient dollar-wise by facing slightly to the west, as the sun is in the western half of the sky during the high peak periods of middle-to-late afternoons.
- Keep your panels clean. A quick hose washing gets off about 90-95% of the accumulated dust, but avoid spraying cold water on hot panels.
How many homes have solar in your zip code area? Link to: TheSolarNerd.
Net metering
Some states, including California, require publicly-owned utilities to offer net metering to homes with solar panels. Net metering uses the Time-Of-Use (TOU) rates previously discussed. The TOU periods generally follow the curve of daily usage.
Link to chart of net metering by state.
Only five states have no policy concerning net metering. Of those five, only Alabama actually levies a charge of $5.41 per kW per month for interconnected solar customers. They really don’t want newfangled solar panels there.
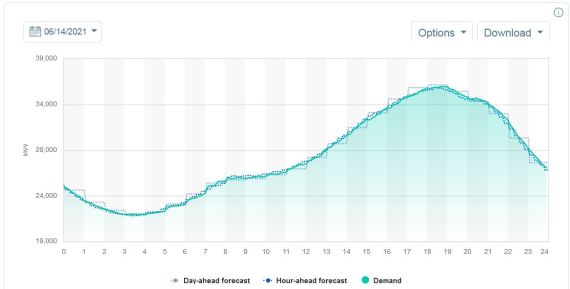
Figure 2. Usage chart for California on 6/14/21, the state-wide highest temperature day so far in 2021. Vertical axis in megawatts, horizontal axis in 5-minute increments. The lowest demand was 21,908 megawatts at 3:40 am, the highest was 35,970 megawatts at 6:40 pm. Average temperature in California ranged 58°-84°F.
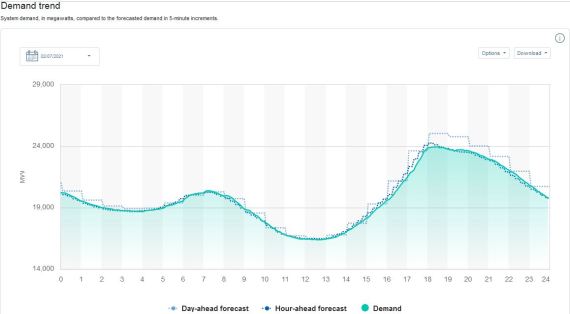
Figure 3. Usage chart for California on 2/07/21, the state-wide lowest peak demand day so far in 2021. Vertical axis in megawatts, horizontal axis in 5-minute increments. The lowest demand was 16,382 megawatts at 12:35 pm, the highest was 23,956 megawatts at 6:30 pm. Average temperatures in California ranged 44°-67°F.
Charging electric vehicles
This is unwelcome news, but the electricity it take to charge your electric car doesn’t fall out of the sky like manna from heaven. (Mmmm….manna. Melts in your mouth.) One site said it will likely cost you more than all the rest of your electrical usage combined. The 100 kWh-battery of your Tesla, by design, won’t charge to full capacity; 50 kWh may be the typical charge. Over 120 brands of EVs other than Tesla average 60 kWh of capacity.
| Cost to charge that Tesla! | ||||
| At local base rate | 25 kWh | 50 kWh | 75 kWh | 100 kWh |
| LADWP | 4.60 | 9.20 | 13.80 | 18.40 |
| Sacramento | 3.20 | 6.40 | 9.60 | 12.80 |
| Tucson | 0.60 | 1.20 | 1.80 | 2.40 |
Figure 4. Cost of home charging Tesla battery with three utilities, four charge levels
Fast charging doesn’t take less energy, just less time, so it costs the same. If you’re charging at home, use an appropriate timer to charge at early morning base rate.
Something to think about: Electric vehicle mavens and wonks say things like: “By 2050 50% of all cars in the U.S. will be fully electric.” True or not, I don’t know. I just wonder where all that extra juice is going to come from. If you’re charging at night, which most people using home charging do, solar won’t help, unless you’re importing it from central Asia where the sun shines as Americans sleep. Perhaps we can extract electricity from the temperature differentials at different depths of the ocean?
Common household electrical uses, sorted by cost
| Home Appliance | Cost at | |
| Energy Usage | Usage kWh | 13¢ / kWh |
| kWh / year | Cost / year | |
| Xbox One | 233 | 30.29 |
| Cable box | 139 | 18.00 |
| Roku | 26.2 | 3.41 |
| Computer tablet | 12 | 1.56 |
| kWh / month | Cost / mo | |
| Water heater | 380-500 | 50-65 |
| Frost-free fridge 15CF | 150 | 19.50 |
| Energy star FF fridge 17cf | 35 | 4.55 |
| Clock | 2-4 | .26-.52 |
| kWh / hour | Cost / hour | |
| Electric furnace | 10.5 | 1.37 |
| A/C Central 3 ton-12SEER | 3 | 0.39 |
| Oven | 2.3 | 0.30 |
| Window A/C 18,000 BTU | 1.8 | 0.23 |
| Hair dryer | 1.5 | 0.20 |
| Space heater (1500W) | 1.5 | 0.20 |
| Baseboard heater 6ft 250W/ft | 1.5 | 0.20 |
| Stovetop | 1-1.5 | .13-.20 |
| Iron | 1.08 | 0.14 |
| Toaster oven | 0.75 | 0.10 |
| Vacuum cleaner | 0.75 | 0.10 |
| Window A/C 8k BTU | 0.73 | 0.09 |
| TV Plasma | 0.4 | < 0.05 |
| Bulb – Halogen 300W | 0.3 | 0.04 |
| Whole house fan | 0.2-0.4 | .03-.05 |
| Sleep apnea machine | 0.2 | 0.03 |
| Computer – desktop | 0.06 | .01-.03 |
| TV LED 4k >75″ | 0.18 | < .02 |
| Fan – pedestal | 0.03 | < 0.01 |
| Fan – ceiling | .025-.075 | < 0.01 |
| TV LED 4k 40-50″ | 0.071 | < 0.01 |
| Computer Monitor 17″ LCD | 0.04 | < 0.01 |
| Stereo | 0.05 | < 0.01 |
| Bulb – Compact Fluor. 8W | 0.008 | < 0.01 |
| Bulb – Heat Lamp | 0.04 | < 0.01 |
| kWh per use or load | ||
| Energy star dryer | 2.28 / load | 0.30 |
| Dishwasher normal | 1-2.17 / load | .13-.28 |
| Electric blanket king size | 1 / night | 0.13 |
| Microwave oven | .12 / 5 min | 0.02 |
| Coffee maker | .12 / brew | 0.02 |
| Toaster | .04 / use | < .01 |
| Additional information at: | ||
| Silicon Valley Power |
Electricity and water
The closest thing we have to enormous electricity batteries we can flick on and off are large hydroelectric dams with plenty of water piled up behind them. So we also have to think about our water supply. A few fortunate locales can channel ocean tidal flows through gates and generate electricity as the tide flows back and forth. Most places have to capture fresh water behind dams. With more and more people and more and more uses for electricity and less and less rainfall and snowfall, it’s getting difficult to capture enough fresh water to supply either our electrical or water needs. With climate change, there’s no rational reason to expect this situation to significantly improve in either the near or far future.
Speaking of dams, they’re not holding as much water as they use to do.
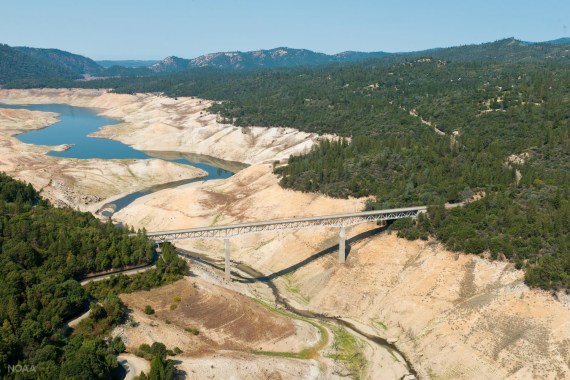
Lake Oroville in 2014, second-largest state reservoir in northern California, Source: California Department of Water Resources
Peaks and troughs of electrical usage are of critical importance. With more and more hotter and hotter days in our foreseeable future coming at us, demand and electrical rates will continue to rise. Our electrical utilities really want us to think a bit more about the juice we use and when we use it. The well is not bottomless.
So they’re coming up with ideas like time-of-use and pre-cooling—and they’ll be far happier campers if we all play along with them. In the long run, so will we.
When it comes to our supply of fresh water, which generates much of our electricity, we may be “circling the drain,” houseboats and all.

Bridge Bay in Shasta Lake, 23 Jan 2014,
water 100 feet below normal level. Source: The Atlantic
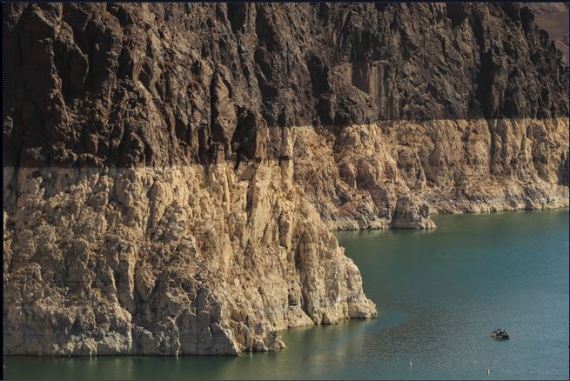
At 247 square miles, America’s largest reservoir, Lake Mead.
Highest level of 1225.44 feet above sea level reached in July, 1983.
Now 152 feet below that.
(Source: Los Angeles Times)
[Posted by Chuck Almdale]
The 2021 Audubon Photography Awards: Winners and Honorable Mentions
Thousands of people entered photographs and—for the first time— videos in this year’s contest. The finest images showed birdlife at its most tranquil, clever, and powerful. The top thirteen award-winning photographs from amateurs and professionals.
[Special bonus: On the NAS webpage is a link to a free copy of Audubon bird guide app of 800 North American birds.]
Additional bonus link:
The 2020 Audubon Photography Awards: Top 100
Take a scroll through this year’s spectacular, artistic, and playful avian images, while reading the story behind each.
Additional additional bonus link:
12 Fascinating Bird Behaviors From the 2019 Audubon Photography Awards
Every year our competition attracts entries capturing rare and unusual moments in the avian world. Check out this year’s highlights.
Links to more photography articles are at the bottoms of the Audubon pages. These photos and their stories are addictive: free time is advisable.
Can birds taste sugar? | The Atlantic
[Posted by Chuck Almdale]
…and what does it taste like?
The Atlantic | Ed Yong | 8 July 2021
Long ago, songbirds executed an evolutionary power move, rejiggering a sensor for savory tastes to react to sweetness.

From the article:
Australia’s unique forests are the birthplace of birdsong. The plants there are drenched in sunlight and can readily mass-produce sugars through photosynthesis. But with few nutrients in the soil, they struggle to convert those sugars into leaves, seeds, and other tissues. They end up with excess, which they simply give away. Flowers overflow with nectar. Eucalyptus trees exude a sweet substance called manna from their bark. Even insects that suck plant sap are forced to excrete surplus sugars, in the form of liquids known as honeydew or lerp. As the biologist Tim Low once wrote, Australia has “forests that exude energy.”
This article contains links to other Atlantic articles on birds and nature, including:
The Birdsong That Took Over North America
Since 2000, a strange new type of song in white-throated sparrows has spread across the continent at stunning speed.
The Wild Experiment That Showed Evolution in Real Time
…they showed that one mutation became more common over time because it creates a physical trait that makes its owners better suited to their environment. It’s the essence of evolution, measured comprehensively.
And those articles contain links to other interesting articles, and……..
The Floating Roost Trial: A novel solution to losses in migratory shorebird habitat | Permanent Link
If you missed our program about the floating roosts in the Yellow Sea, Birdlife Australia has a permanent video, also produced and presented by Chris Purnell. Time: 42 minutes.
Want to donate to this project? Contribute directly to Birdlife Australia. In the “Comments” section tell them it’s for the “Floating Roost Project.”
“Getbol, Korean Tidal Flats” inscribed on UNESCO World Heritage List
EAAFlyway.net | 26 July 2021
Cool photos, short new report video
On 26th July, 2021, the 44th Session of the World Heritage Committee endorsed the inscription of the Republic of Korea’s tidal flats on the UNESCO World Natural Heritage List, marking an enormous step forward to secure the critical habitats of the Yellow Sea for millions of migratory waterbirds that depend on this area as a vital stopover on their migratory journeys from as far away as Australia and New Zealand to breeding grounds in Arctic Russia and Alaska.
Chris Purnell created a shorter video on the project. Time: 14 minutes.
About above video:
Chris Purnell (BirdLife Australia) presents “Trialing Floating Artificial Shorebird habitat: a response to losses in the upper intertidal zone”as part of Session 4: Foraging and roosting held online on Nov. 3, 2020 at the 1st East Asian-Australasian Flyway Shorebird Science Meeting.

Articles in the news
Artificial roosts for migratory birds journeying from the Arctic prove popular in Korea, but not in Australia
ABC Newcastle | Ben Millington | 1 Jul 2020
Repurposed Oyster Farm Bags Offer New Real Estate for Migratory Birds
Scientific American | Priyanka Runwal | 4 Mar 2020
South Korea’s artificial floating roosts: a lifeline for migratory shorebirds
BirdLife International | Ding-Li Yong | 15 Oct 2019
Contact information for Chris Purnell
Floating Roost Trial – Contact Page
Geum Estuary Project – Information & Videos
The Floating Roost Trial: a novel solution to losses in migratory shorebird habitat.
Appropriate high tide roosts (resting areas) are necessary to help migratory shorebirds maintain a positive energy balance while making journeys of over 10,000 km to and from breeding grounds. However in many areas of the Yellow Sea coast these areas are the first to be affected by development and disturbance. Our surveys of one critical staging area identified that 6 of the 7 natural roosts were only available to birds on 44% of high tides. During these periods it is estimated that over ten thousand birds may be without appropriate local roosting opportunities.
In response to this issue the project promoted established responses to artificial roost construction, however due to the urgency of the requirement and recent changes to legislation forbidding construction on intertidal areas, we were forced to think outside the box. BirdLife looked to an unlikely partner, the oyster farmers of Australia. Floating oyster farm infrastructure is utilized by shorebirds in the east coast of Australia. We developed the Floating Roost Trial by optimizing commercially available materials as roost sites in highly modified coastlines. Two years later we have some positive results from phase 1 and are looking forward to phase 2.

With a background in field ecology, Chris Purnell now manages BirdLife Australia’s Wetland Birds Program, overseeing and implementing a portfolio of works focusing on conservation outcomes for the unique birds of Australia’s diverse wetland types – from coastal sites to arid ephemeral wetlands. Chris’ current project focus includes the effective use and delivery of environmental water, species recovery of Australian Painted-snipe and Australasian Bittern and shorebird conservation management in Indigenous Protected Areas and the Republic of Korea.

Platforms, adapted from oyster farming, staked out at low tide; come high tide they’ll be afloat.


